NEW: Online wizard

Optimizing Mari for best Performance
Benchmark based ramblings about optimizing your Preferences for better Texturing Experience in Mari
Intro
Mari's preferences (a texturing application by Foundry) allow you a large amount of different combinations to tweak your performance.
Unfortunately the effect of these settings is not well documented.
I wanted to know - once and for all - how to best utilize my hardware for best performance, so I did very extensive automated benchmarking.
Disclaimer: These settings are balanced to my personal hardware. Your results might be slightly different
My System Specifications
- CPU: 11th Gen Intel Core i9 11900KF @ 3.5GHZ
- MEMORY: 64GB RAM
- GPU: Nvidia Geforce RTX 3900, 24 GB VRAM
- MARI SCRATCH/PROJECT DISK: 500 GB PCI-E NVME internal SSD, roughly 200 GB free space
My FASTEST Settings
I am going to give my best settings here at the start, instead of making you scroll to the end.
You can read on - or not - , how individual settings affect your performance to better understand the individual settings.
Please note those "optimal" settings are based on my system. Your mileage with other systems may vary.
Given that I am the only one I am aware of, that ever actually benchmarked 2000+ different settings, I am fairly confident though that a lot of my findings in the Settings Explanation are
transferrable to other systems - so it might be worth a read.
The two main tabs with settings that affect performance in the Mari Preferences (found under the Edit Menu) are
- Data Tab
- GPU Tab
So without further ado, here are my settings


The Benchmark
I wrote a Mari Benchmark Python Script that ran 3 different sets of tests over a lot of combinations of settings.
Over 2000 settings combinations were tested in total, over the span of roughly 50 hours.
While the total amount of possible settings combinations (within my test bed) is a whopping 47000, I opted to skip over a whole bunch of the lower settings, by not allowing them as options in my script. This dramatically reduced the overall amount.
From initial tests I knew they would give poorer results on my system and not be contenders for "Best performance", so I didn't want to spend considerable Benchmark time on them.
To further tweak the benchmark time, I then defined 'spreads' of settings. Meaning that only every 5th setting combination would be tested, giving me still considerable data over the range of
settings to identify trends.
I plan to make the Benchmark available as a proper tool in Mari Extension Pack at one point, once it is a bit more refined and user friendly.
The following elements were tested
- Bake Performance (e.g. baking down a node to a bake point or channel)
- Projection Performance (e.g. projecting a brush stroke onto a geometry)
- Viewport FPS
Export speed was NOT tested as this is purely write speed to disc and cannot really be improved via settings
Mari ran alone. There were no other graphics intensive Applications open.
If you are sharing resources across applications you will have to account for that.
Bake performance test
- Test performed on a plane with 100 Polygons uv'd to 100 UDIMS
- For each setting combination:
-
- a cloud node was generated
- a bake point was generated at 4k, 16bit
- cloud node and bake point were connected
- bake point was baked and bake was timed via python (timer start before bake call, end after it completed)
- after the test, all nodegraph data was deleted and the memory completely cleared for the next test
projection performance test
Brush speed projection tests were performed with a 2k,16bit Paint buffer since this is what I use most.
TEST 1 - Projection onto a lot of 4k UDIMS
- The view was positioned to show all of the 100 UDIMs on the Plane
- a 4k,16bit Paint Node was created
- a 4k image was loaded into the paint buffer (while the image was 4k, by loading it into the 2k paintbuffer it became 2k)
- the paintbuffer was projected onto all 100 UDIMs at once and the projection speed was timed via python
TEST 2 - Projection onto a single 4k UDIM
- The view was positioned to show a single UDIM of the 100 UDIMs on the Plane
- a 4k,16bit Paint Node was created
- an image was loaded into the paint buffer (while the image was 4k, by loading it into the 2k paintbuffer it became 2k)
- the paintbuffer was projected onto the single UDIM and the projection speed was timed via python
VIEWPORT FPS Test
Viewport FPS tests are a bit tricky as it is heavily influenced by
- what you are viewing
- how close to the object (e.g. the full resolution of what you are seeing) you are
- background processes (e.g. figuring out how to avoid the benchmark itself not influencing the FPS)
The Viewport FPS Speed Test was performed by viewing a 16bit, 4k Paint Node with 100 UDIMs with "Pause Canvas Rendering" Option disabled (as this option stops viewport redraw if not required and
nothing is happening).
The camera position was chosen to show about 1/3 of all 4k UDIMs of the object (~33).
The python call canvas.fps() was called repeatedly, while the camera rotated, and the average FPS count was determined.
What about that "spnning wheel" ?

The infamous "Mari Spinning wheel" is unfortunately a subject of its own, and really there's not much to do about it.
As such it was not part of the Benchmark.
The Spinning Wheel happens when Mari compiles the code of ALL nodes/layers you are currently viewing into a program (a shader), that is then executed on the GPU.
The only way to really reduce the "Compile" Time is to have less nodes or less complex nodes in a chain - or "collapse" them by prebaking them to Bake Points or Paintable Nodes.
At the end of the Settings Explanation below I will briefly cover 2 settings that have an effect on the frequency of the Spinning Wheel.
However the general time it takes for Mari to compile a shader is fixed, and can only be improved by the GPU Manufacturer's Drivers or reduced node chain complexity (again - bake points are your
friend)
There are however 2 ways you can slightly reduce the time it takes for the spinning wheel:
1. Exclude the Mari Executable from your Virus Scanner e.g. Windows Defender
2. Set the Mari process priority higher (on windows via task manager)

what preference does what ?
Let's dive into the different preferences and try to decipher how they affect performance.
So am i an expert in mari preferences ?
I am not an expert on exactly what is going on behind the scenes so these conclusions are based on
- the hard data of the benchmarks.
As I tested a lot of combinations (2000+) I could see a trend what a preference setting influences.
There might be some skewing in the data, however I did run the top results multiple times to eliminate bias.
While the "best setting" of each test cluster was not always identical, the general tendency seemed clear.
- As I have 12+ years of Mari experience I do have some background of what setting does what - though the technical details might not always be 100% correct.
Ergo my deep dive to refresh myself on what affects the performance.
- Some information about what a preference does, I simply inferred from the Help files as well as some discussions with current and former Devs on the Mari Discord. (thanks to Rory Woodford for filling in some blanks)
Knowing all this let's get going:
MEMORY AND MEMORY WRITE FACTOR
These settings can be found in the "Data" Tab of the Mari Preferences.
Max Memory
I have 64 GB of RAM. By default on my machine, Mari sets this setting to 16GB.
I did not see any notable difference in changing this value, which I guess is a testament to Mari's good memory management.
I know from experience that this setting is a soft limit. Even with its 16GB Value, Mari will not really stop at 16GB RAM when it needs more.
Based on my observations this "Max Memory" Setting only is taken into account during baking operations, which would explain why changing its default 16GB Value did not give dramatic differences
in my test bed:
- My tests were performed with baking 100 4k, 16bit UDIMs.
-
- a 2k, 8bit file is 16 MB
- a 2k, 16bit file is 32 MB
- a 2k, 32bit file is 64 MB
-
- a 4k, 16bit file therefore is 128 MB.
- that means that during my baking of 100x4kx16bit UDIMs even if Mari would dump everything into RAM at once, I would use a maximum of 12.8GB of RAM (100 x 128MB), not really touching that 16GB limit
- If instead of 100 x 16bit 4ks I would have used 100 x 32bit 4ks, the total memory usage of that data would have been 25.8 GB.
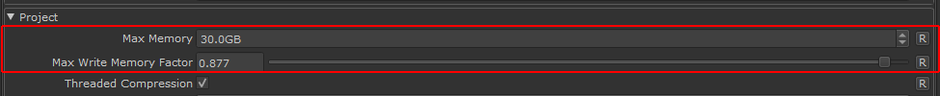
Therefore I decided to set this value to 30GB out of my available 64GB, to give Mari plenty to work with even when working with 32bit channels , accounting for extreme cases and still having
large reserves for when it decides to take more or when I need to do something else on my machine
RECOMMENDATION
Set it to half your available System Ram
Max WRITE MEMORY FACTOR
While the Max Memory Setting had no measurable effect in my benchmarks, the "Max Write Memory Factor" had massive effects on Bake Speeds.
As per the help file:
"The setting controls up to how much of the Max Memory (the setting above it) is used to temporarily hold the data to be written to disks."
So this means, this setting will directly affect Bakes (e.g. exporting, Bake Point Baking etc.), as Baking writes data to disc, into Mari's Project Cache.
Sure enough the results of changing this were quite dramatic:
- MAX WRITE MEMORY Factor Value of 0.9 resulted in a bake of 00h:00m:42s
- MAX WRITE MEMORY Factor Value of 0.5 resulted in a bake of 00h:01m:12s
Actually my Benchmarks suggested that just flat out setting this value to 1.0 would be the best, however I felt because I was using Mari in isolation on my system, it would be best not to push my luck.
So I opted for a Benchmark setting that only was marginally slower (0.877 vs 1.0) while being aware that my 100 UDIM test were at no point really maxing out the Memory anyway.
Please note, that this setting only exists in the preferences since Mari 6.0.
In MARI 4.8 and 5.0, this setting is only available via an Environment Variable
- MARI_MAX_WRITE_PENDING_SIZE_FACTOR
So you would need to specify this environment variable with your value (e.g. MARI_MAX_WRITE_PENDING_SIZE_FACTOR= 0.75) if you are using previous Mari Versions.
RECOMMENDATION
Set it to somewhere between 0.7 and 0.9. It makes a lot of difference. If you have a more than 64 GB of RAM or use Mari in isolation, even higher is good.
BAKE BUCKET SIZE
The "Bake Bucket Size" setting can be found in the "GPU" Tab of the Mari Preferences, at the bottom of the "Baking and Projection" Group.
Not to be confused with the "Render Bucket Size".
The "Bake Bucket Size" determines how many pixels Mari will simultaneously process before flushing it out of its memory and moving on to the next "Pixel Bucket".
One slightly complicated aspect of this setting is that it affects both "Baking" as well as "Projections" meaning it will impact
- the speed at which you generate data ready for export, bake bake points, convert nodes or layers to paintable nodes
- the speed at which a brush stroke in the viewport gets projected onto your model's UVs.
Raw Baking Speed
The results for pure Bake Speed - in my case baking Bake Points over and over with different settings - were very obvious.
For raw Bake Speed you want that "Bake Bucket Size" as high as possible, being equal or roughly equal to your Virtual Texture Bake Size Setting (more on that setting further below).
This finding was not entirely surprising as for baking 100x4k UDIMs it will be faster to process as much as possibly in one go. Instead of processing smaller chunks, flushing the memory and moving on to the next chunk, which adds overhead.
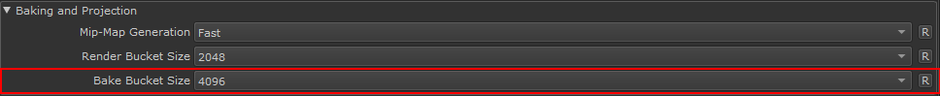
The best setting combination for Bake speed for me was with a "Bake Bucket Size" of 16k and a "Virtual Texture Bake Size" Setting of 26.624 x 26.624.
A Bake Bucket size of 32k was a bit slower, surprisingly.
After checking the logs I saw a lot of "Excessive Data in Queue' Messages, indicating that all my combinations of settings in this case exceeded the Memory somewhere, which is why 16k was a good compromise and ran actually faster than 32k.
Interactive Projection & Working Speed
So you might ask why in my "Best Settings" this setting is at 4k after all, if 16k was so much faster for me.
The reason is the previously mentioned influence of that setting not only on Bake Speed, but also Projection Speed - so projecting paint from your paint buffer onto the model.
Having it at 16k added a noticeable & measurable (up to 0.8ms) delay whenever a Paint Stroke was baked down.
While the actual projection (the time it takes for the progress bar to complete) was faster, it took a while for the progress bar to appear in the first place, compared to a 4k setting..
So what's the story with that ?
It turns out it's easy.
Let's say I am making a brush stroke that crosses over four 4k UDIMs.
The fastest bucket size for baking such a projection would be a 8k Bucket.
If my Bucket size is 16k or 32k with such a paint stroke, there is a lot of excess data that needs to be processed (even if it's empty) and a 16k "Image" needs to be loaded into Memory. This
initial load is the delay I was seeing before the progress bar appeared.
If instead of doing a projection onto your model , you are baking a Bake Point (so a lot of UDIMs at once) , you only load in that 16k image once, while painting and projecting loads in that 16k
image over and over whenever you project.
So for baking, the speed gains of having only one larger image completely justify the delay of loading that image (once).
While having that delay each time you paint & project adds up.
So what do I set this setting to ?
Based on my benchmarks simply ask yourself:
- what is your most frequent UDIM size in your project and how much of this UDIM size do you usually cover with a paint stroke
This is what you want this "Bake Bucket Size" to be at.
- For me a 4k "Bake Bucket Size" setting while painting over an entire 4k patch caused a minimum delay of 0.2ms, until the Progress Bar appeared. It feels as good as if there's no
projection.
- At 2k "Bake Bucket Size" , painting over a 4k UDIM, the delay was a bit higher at 0.3
- At 2k "Bake Bucket Size", painting over a 2K UDIM the delay was below 0.1.
It's basically real time at this point, without any noticeable projection downtime.
So I opted for 4k for myself to cover all eventualities.
In general MARI is and always has been a beast when running 2k UDIM sizes, no matter how many 100s of UDIMs you throw at it.
However usually I work at 4k .. so I choose to leave the setting at 4k, knowing that I can change it to 2k if I really have a project where it is worth it (a project with mostly 2k UDIMs).
If on the other side you really only want to have your raw Baking Performance - for example if you are running Mari exclusively on a Machine as your "Baking Slave" and not doing any painting - you will want to set this preference quite high to get your maximum Bake Speed.
That being said, My tests were not production node networks but a simple cloud node piped into a bake point.
If you have large node networks (think hundreds of nodes) to bake, there's a good chance MARI needs extra memory to write
"In-between states" of nodes (for example to process compositing operations).
Meaning you might want to stay under the maximum bake bucket size you can fit in your memory .. and leave extra space in order to not max out the memory use.
RECOMMENDATION
Long story short, my suggestion is to flat out stay in the 2k to 4k range on this setting, depending on what is your usual working resolution for UDIMs. If you work mostly with 8ks, go 8k - if
you only work with 1ks, go 1k.
RENDER BUCKET SIZE
The "Render Bucket Size" setting (which is above the "Bake Bucket Size" Setting) only has an effect for example when you create "Unprojections" from a Projector or render highres Viewports (e.g. Screenshots). As such this setting has no bearing on Bake or Viewport Performance.
MAX IMAGE MEMORY ( & Persistent Mapping)
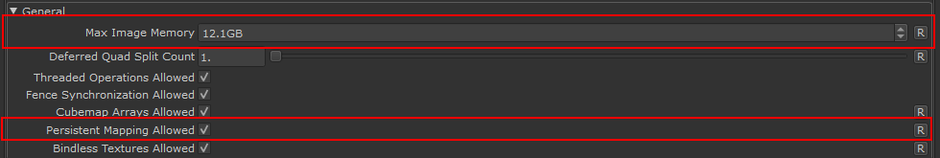
The "Max Image Memory" and "Persistent Mapping" Settings can be found in the GPU Tab of the Mari Preferences, within the "General" Group
Max Image Memory
The "Max Image Memory" setting is a misleadingly named preference.
It only affects images that are loaded into Image attributes on Nodes, as well as filter operations performed on Images (think Blur Filter for example).
This setting has only marginal effects on Bake speed and absolutely no effects on Paint Projection Speeds.
It can however affect your Frame Rates in the viewport if set too low.
MARI maintains two big memory buckets for Images.
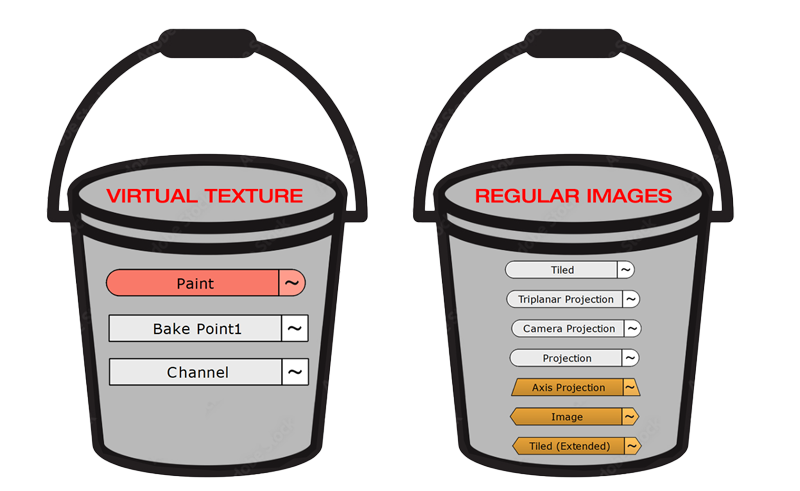
- The Virtual Texture, which houses data from Paint Nodes, Bake Points and is used as a "Temporary Target" when baking a channel for export. (more on Virtual Textures below)
- A database of images that are loaded into images such as Tri-planars, Tiled Nodes, etc.
To test the effects of the "Max Image Memory" Setting, I set it to 2GB and created a Camera Projection Setup, with 30 different 6k Images being live projected via "Camera Projection Nodes".
The FPS in my viewport was around 27 FPS, which is too slow to do any real work.
Clearly the Memory for images was too low.
By raising the Max Image Memory to 6GB, my FPS already had recovered to 243 FPS.
To give myself plenty of room to work with images I decided on a 12GB Memory allocation, knowing of course that this - in the worst case of using many, many images in my project - only leaves 12 GB for the Virtual Texture. (on my 24GB Card).
Other than for example the "Max Memory" Setting in the "Data" Tab of the Preferences, Mari indeed seems to respect the setting value as a hard limit.
Meaning if you are using less, the memory stays free for other things, while when using more, you are punished by dramatically reduced FPS.
RECOMMENDATION
If you heavily use images in Nodes other than Paint nodes and Bake points, give yourself plenty of Memory here.
Just think how how many images you are using in your Nodegraph via Tiled or Tri-planars and multiply that value by 256MB to assume the worst case.
Persistent mapping Allowed .. a double-edged sword
Persistent mapping is a difficult one.
The general help says that it improves bake performance when doing multiple successive bakes (e.g. channel exporting).
And indeed I have seen it improve performance on one system ... and absolutely tank bake performance on another.
On one system I had an export of 19 seconds, on the other system (same export) it froze the machine for 90 seconds at 75% baking so the exports would end up being around 2+ minutes in
the end.
It seems heavily dependent on what GPU you are on.
On my consumer card it worked well, however at work on Studio cards like a Quadro 4000 or RTX 4000 ada it was a disaster.
So I would suggest you turn it on and see if you have on export or bake a long pause at a certain percentage of bake. Then repeat with Persistent Mapping Off and see if the pause goes away
RECOMMENDATION
Undetermined. Seems to depend on hardware
The Virtual Texture
aka VTS (Virtual Texture System) or SVT (Sparse Virtual Texture)
What is it ? (and why is it cool)
The Virtual Texture is the heart and soul of Mari and the reason why it can display and work with massive data amounts that far exceed the VRAM of your GPU. It is at least partly the reason MARI is still working long after Substance Painter calls it quits because of too much data.
|
Remember our "Buckets" above in the "Max Image Memory" Section. |
Think of my test scenario, where I could have 100x 4k 32 bit Textures created via a Bake Point.
( I used 16bit to benchmark but that's beside the point)
The total memory consumption of those 100 images at 32bit would be 25.6 GB, which exceeds my GPU VRAM (24GB total) by a good 1.6 GB (if nothing else would be on the GPU at the time).
So without the SVT I would not be able to view or work with these 100 Images, much less 100 images per Node multiplied by a dozen or hundred.
Think of the Virtual Texture like a very large Image made out of a mosaic of tiny images (I think I once read that no image block is larger than 50 kilobyte)
The maximum size/resolution of that combined Mosaic is the size defined by the Virtual Texture Size Setting and the entire image covers all UDIMs of your Object.
Each mosaic can be independently swapped out by Mari, without having to swap or recreate the entire large image.
Depending on what you see in your viewport Mari will fill in these mosaics with data from your UDIMs.
Let's quickly take our 100 UDIM example again:
- If you are far away and looking at all the 100 4k UDIMs at once, Mari will load in all UDIMs into the Virtual Texture,
However since your Monitor can only display a fraction of all the pixels in the 100x4k images viewed at once, Mari streams lower resolutions (mipmaps) of those UDIMs into the virtual texture.
So if your Virtual Texture is set to 16k, you can at any point only see 16k worth of pixel information on your screen (again which might not be necessary, so Mari goes even lower)
- If you zoom in and only see 4 of the 100 UDIMs, Mari will discard all the other UDIMs in the Virtual Texture (replace them with tiny 8x8 pixels versions) and only load in those 4 visible UDIMs into your Virtual Texture. Even those 4x 4k UDIMs might be more pixels than you need, so Mari will again determine if the highest resolution is even necessary.
|
You can "offset" the loaded mipmap by lowering the "Gather Scale" Setting in the Preferences |
As each block in the Virtual Texture is tiny, Mari can do fine differentiations and only load in small sections of a single UDIM as high resolution info, while other parts of the same UDIM are streamed in as lower quality
|
If you ever looked into your Mari Project Directory, you will notice thousands of tiny files. Those are the image blocks that make up a complete UDIM's baked Information. These image blocks are then used to fill the tiny blocks in the Virtual Texture in a very granular manner, each block having different mipmaps
|
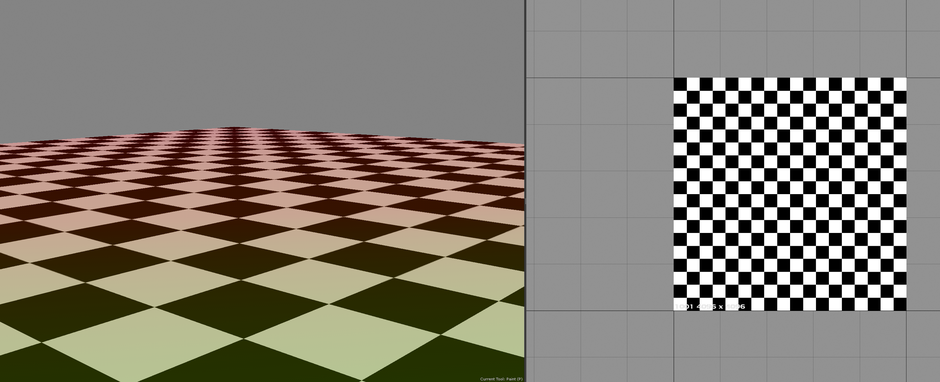
Below we see a single image baked into a Paintable Node.
In the perspective view (left) we see that only a tiny section of the map is necessary in its highest fidelity (green), while other parts of the same single image can be treated as lower
resolution.
Disclaimer: While in the below image a gradient is used, in reality it is actually a "blocky" system, meaning there is no change in resolution "within a
block".
Virtual Texture Settings
So we know that the Virtual Texture's main purpose is to handle the viewport display of (baked) data in Mari.
However it is also used for baking paint. So if you are baking a node or projecting a paintbuffer, this data first goes into the Virtual Texture and then gets written to disc from there.
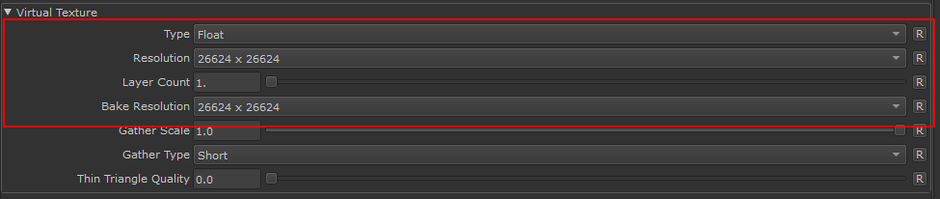
The Virtual Texture Settings can be found in the GPU Tab of the Mari Preferences under the "Virtual Texture" Group
Virtual TEXTURE TYPE / DEPTH
As the name implies, this specifies the Bitdepth of the Virtual Texture used to display things in the viewport. So...
- BYTE = 8 bit
- HALVE = 16bit
- FLOAT = 32bit
For the sake of the initial argument we can say that this only affects your display. It has no bearing on the bitdepth of the actual data in your project which is always at the highest original data fidelity.
- So setting this Virtual Texture Depth to Byte/8bit and viewing a 16bit channel will display the 16it data of the channel in 8bit, but not change the source data which stays 16bit.
- Similarly, projecting from a 32bit paint buffer onto a 32bit paint node ends up as 32bit data on disc even if the Virtual Texture is set to 8bit (remember all bakes go through the Virtual Texture System as well)
This effect is the most notable, when viewing bump maps in Mari. Even if you authored a nice, smooth 16bit Bump Map .. if you view the result with a 8bit Virtual Texture you will see stair-casing/stepping inside Mari's Viewport, but when exporting and rendering the map ,the result will still be smooth.
All of that being said, having the VTS Bitdepth at 8bit or 16bit significantly increases your Frame count (FPS) in Mari's Viewport.
..but .. but .. you have it at Float/32bit in your "Best Settings" ...
For my benchmarks a "Float" Virtual Texture (32bit) decreased the FPS in Mari's Viewport but at the same time also decreased time it takes to bake.
We will cover the why in the "Bake Resolution" Setting below. So just know that the Float Setting can actually speed up baking if you can live with the decrease in FPS.
RECOMMENDATION
Set it to Float to avoid having to manage two separate virtual Textures.
Only if you really need to squeeze extra Viewport FPS go to Halve or Byte.
Virtual Texture resolution & Bake Resolution
Quick important fact
In the interest of not burying important information, here is an interesting set of facts straight at the beginning:
- If you set your Virtual Texture Type/Depth to anything other than "Float" you will end up with two Virtual Textures. One for Viewing, one for Baking.
Since Mari uses the Virtual Texture also for Baking paint - not just for displaying - it needs to have the VIrtual Texture at its highest possible fidelity in order to not loose information during the Bake process - If for example you set your Virtual Texture Resolution to 16k and "Byte" (8bit), the setting "Virtual Texture Bake Resolution" is used to determine the size of the second Virtual Texture for Baking. This second "Bake" Virtual Texture will always be at "Float" (32bit)
- If your main "Virtual Texture Depth" is set to Float, Mari will not create a second Virtual Texture and always use the main Virtual Texture for both Viewing and Baking. So the "Virtual Texture Bake Resolution" Setting is ignored and only the "Virtual Texture Resolution" Setting counts.
- Having two Virtual Textures adds a delay to the Baking Process while Mari removes the "View" Virtual Texture from the GPU and loads up the "Bake" Virtual Texture
Influences FPS, baking speed and Viewport stability
The resolution and depth of your Virtual Texture in a pure "Viewport Context", heavily affects your viewport FPS count when you have any sort of baked data in your node chain. If the resolution is too low, it can also cause visual artifacts and flickering of texture block.
In a "Baking Context", the size can impact the bake speed .. and if too low completely mess up your bakes when Mari is unable to push the amount of data you are asking it to bake, through a too
small Virtual Texture (and not even the "Bake Bucket size" helps to split the data into smaller amounts.)
How to find the right size
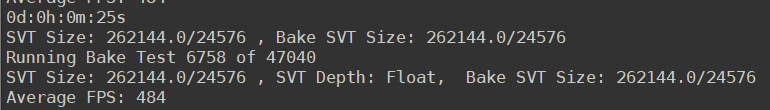
In my benchmarks having the highest possible sizes were consistently giving the best FPS count and Baking Speeds.
The best benchmark results were with a resolution of 30720 x 30720. However given all the other elements that need my GPU memory (that weren't represented at the time of baking e.g. high image count via tri planars etc.), I chose a slightly lower resolution of 26624x26624.
This roughly equals 11GB of GPU Ram in use for the Virtual Texture at "Float" / 32bit bitdepth, giving me another 13 GB available on my GPU for other things.
The math behind this 11GB is the following:
- 2048x2048 @ 32bit = 64MB
- 2048x2048 = 4 194 304 total pixels
- 26624x26624 = 708 837 376 total pixels
- 26k total pixels / 2k total pixels = 169
- 169 x 64 MB = 10.816 MB
RECOMMENDATION
- Set both Virtual Texture Resolution and Virtual Texture Bake Resolution to a very high value, using half of your GPU Memory and more
- As we learned from the first and second paragraphs, you can increase Viewport FPS by setting a lower "Depth" to your Virtual Texture, however this comes with a penalty of lower Bake + Projection Speeds. So unless you really need the extra FPS I recommend leaving the Depth at "Float" to have the best of both worlds.
- If you choose to set it to "Byte" or "Halve", make sure that your "Virtual Texture Bake Resolution" is also very high - I chose the same 26624 x 26624 as my main Virtual Texture Resolution
Virtual Texture Layers
I have to admit I did not entirely know the benefits or usage of the Virtual Texture Layers.
As increasing the Virtual Texture Layer amount means I have to decrease the actual Size of the Virtual Texture (more layers = more memory) I always set the Layer count to 1.
My Benchmarks did not give any indication that more layers and smaller Virtual Texture Size are favorable over a large Virtual Texture with a single Layer. As a matter of fact the results were
pretty much the same no matter if the final resolution was a achieved with
- a single Virtual Texture Layer x Virtual Texture Resolution
..or.. - multiple Virtual Texture Layers x Virtual Texture Resolution.
After reaching out to Rory Woodford - Mari's former Product Manager - he gave the following explanation, which is in line with my findings:
"There used to be a performance hit/gain for old GPUs if you performed texture lookup calls against a very large texture vs a layered texture dataset. I don't think there is any
difference in modern GPUs, but the preference is still there as an option to customize how VT are encoded into VRAM"
So long story short, the setting is largely legacy on any GPU build in the 2020s and you can just set the option to 1, and just rely on tweaking the resolution.
Setting might be relevant in the future again
I imagine though soon, once we have very very large GPU Memory, this setting will come in handy again as Mari is currently "limited" to a maximum size of 32k x 32k for the Virtual Texture.
That means your maximum required memory for a 32bit Virtual Texture would always be 16.38 GB.
Imagine having a 48 GB VIdeo Card - in that case you could probably quite safely set the Virtual Texture resolution to 32k and increase the Layercount to 2 and still only use 33 GB Video
Memory.
RECOMMENDATION
Set it to 1.
Dealing with the spinning wheel

As mentioned early on in this write-up, the spinning processing wheel time is not really something that can be reduced, as it is the process of compiling all your nodes into a single
shader. So more Nodes means more Code to process, means longer spinning wheel.
There are however some settings in the Preferences that influence the frequency you see the spinning wheel at.
So for completion, let's cover those as well, although this was not part of my benchmarks and I see little point in changing the defaults.
Your overall best chance to reduce spinning wheel times remains
- using Caching (in the Layer stack)
- adding Bake Points (Nodegraph)
Caching or Bake Points remove(s) many lines of code from the shaders that Mari is compiling during this "Spinning Wheel" time, by replacing it with a simple "Texture Lookup" -- ergo reducing the time it takes the spinning wheel to complete.
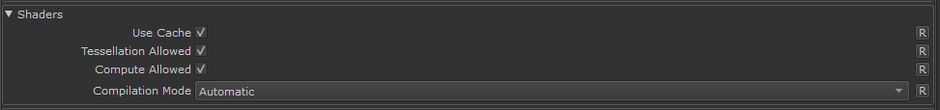
The main settings having an influence on the spinning wheel can be found in the "GPU" Tab of the Mari Preferences under the "Shaders" Group.
Use cache
When turned on, Mari will cache the results of Shader Compilations.
You can see the effect quite clearly, when this is turned on
- if you create for example a "Cloud" Procedural, the first time you view it, you will get a spinning wheel
- if you create a second "Cloud" Procedural and view that one .. no more spinning wheel. Because Mari cached the Code of that Shader compilation already
So there's really no good reason to turn that setting off, unless for some obscure reason you need a node to be recalculated no matter what
RECOMMENDATION
Leave it on.
Compilation Mode
The Compilation Mode Setting is the only lever you can really pull, to control how often you see the "Spinning Wheel".
I personally leave it on its default "Automatic" 100% of the time.
DYNAMIC
Dynamic mode has very fast spinning wheel times at the cost of being a heavy shader to render. This means that, whilst your computer will remain active, you will experience a slower frame rate once the spinning wheel completes, but the spinning wheel will be short. Dynamic mode works by caching multiple operations to be used quickly so that, whilst initially you may still get a spinning wheel, from the second time you perform a specific operation your shader shouldn't need to recompile.
OPTIMIZED
Optimized mode, once compiled, is a lighter shader to render so often offers faster frame rates. However, when compared to Dynamic mode, the process of compiling the shader is slower (longer spinning wheel), causing Mari’s spinning wheel to appear in the viewport more often and longer.
AUTOMATIC - Set by default
Automatic mode is not a single type of Shader Compilation but rather makes use of combining both the Dynamic and Optimized modes for a parallel compile which provides faster, cleaner results in the Mari viewport. Whilst working in this mode, artists will experience the maximum amount of optimizations
RECOMMENDATION
Leave it on Automatic.
The only time you would want to for example force this to "Dynamic", is if you have good enough Frame Rates already and your current Node network can comfortably be executed on the GPU.
Then setting the "Dynamic" mode will reduce the amount of time you see the spinning wheel - while causing lower FPS than not having it on Dynamic.
Outro
I hope this lengthy Explanation can help you tweak your Mari settings.
Running the benchmarks definitely taught be a few things about how to best utilize my hardware and I found that many of my assumptions were outdated and no longer applied to my current System
specifications.
Addendum
How different system components affect Mari Performance
Addendum supplied by Rory Woodford
- More TFLOP capacity on your GPU will give you more FPS in the Canvas for painting and viewing your object.
- More VRAM will reduce bucketing requirements for flattening Channels which will speed that up, it'll increase visual fidelity in the Canvas of paint and cached layers and it'll
allow you to use higher resolution Paint Buffer sizes.
- More RAM will increase the amount of image data that can be imported into a Layer from image files, before Mari needs to start queuing (import progress bar is fast until RAM is
full)
- The faster your SSD read/write speeds are the faster Mari can stream data to/from disk. This is done in the background and should never block the app unless other bottlenecks exist.
Bottlenecks here manifest in getting sudden texture resolution popping in the Canvas, or have to wait longer for Mari to shutdown if still writing to disk on close, or in the worst case, waiting
longer between each paint stroke bake before the next.
- More CPU cores will help parallelise disk streaming a bit, but not by orders of magnitude. CPU core count and RAM amount paired together should give more performance to importing
gigabytes of UDIM sequences into Mari layers.
- The better the OpenGL Driver for your GPU supplied by its manufacturer, the less chance of drawing/painting/baking artefacts occurring in your project data. Unfortunately the
grey spinning circle is indicating that Mari is waiting for the project shader to compile, and this process's performance is bound to the OpenGL Driver and there is nothing your hardware can
do to reduce the time it takes to compile and link a complex project Canvas shader.
You can improve its compile times by managing project complexity, caching layers and groups (Layerstack) and using Bake points (Nodegraph) you don't intend to edit live for a while, as many layers of branching procedurals are directly responsible for slowing down the shader compilation.
- Project UDIM count has no bearing on shader compile times or FPS as Mari handles them via a Sparse Virtual Texture system (SVT). This means your project could be 1 UDIM or
1000 and the compilation time and FPS should be the same.
- Project Complexity (amount of layers or nodes being currently viewed) increases shader compile time and decreases Canvas FPS